In this post, the work with Node-RED and its interaction with OSCAR services will be continued. Two workflows will be presented where you interact with OSCAR services using the Dashboard tool, which will ultimately provide a web interface for the user. In general, there will be a choreography of various OSCAR services, where the backend part will be in the workflow programming part and the frontend will be in the web interface provided by the dashboard.
1. Choreography of OSCAR services with Node-RED using web interface with dashboard.
Two examples of interaction with OSCAR will be shown below. The first workflow shows a dashboard where the user can interact with all OSCAR services. Through a web interface, the user can enter the input data to the services (text messages or images), which will process and in turn display the results returned by the services. All this through a simple and easy-to-use interface.
The second workflow shows us an interface where, through the introduction of an image, its processing is done. Here two services (grayify and plants) are called, where the output of the first service (grayify) is the input of the second service (plants). Being able to invoke two services synchronously with a single data entry. All the results of each process are displayed in a web interface where the user has to enter the location of the image to be processed and the processing of the same will be returned by this created workflow.
1.1. Dashboard as a visualization element in Node-RED.
One of the advantages of Node-RED is that web interfaces can be created from workflows that allow users to interact with different services without having to modify the workflow. Making a comparison, the dashboard displayed by Node-RED would be the front-end and the flows would be the back-end of an application . The dashboard layout should be thought of as a grid. Each item in the group has a width: 6 units by default (one unit is 48 pixels wide by default with a 6 pixel gap). Each widget in the group also has a width: by default, ‘auto’, which means it will take up the width of the group it’s in, but you can set it to a fixed number of units. It is possible to use multiple groups if possible, instead of one big group, so that the page can dynamically resize on smaller screens (Figure 1).
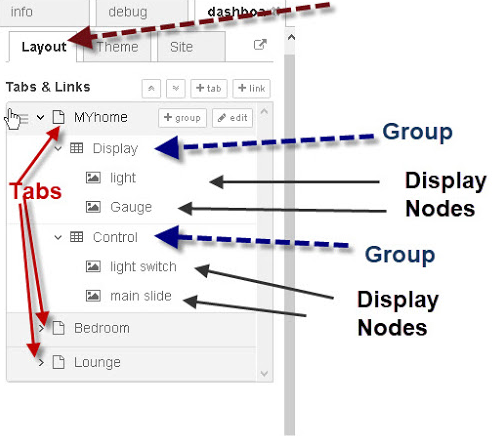
The dashboard is accessed with http://IP_NodeRED:1880/ui (Figure 2).
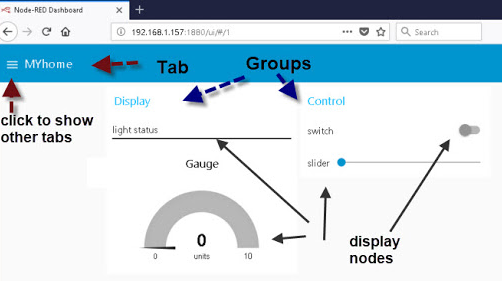
If you want more information you can get it in node-red-dashboard or getting started node-red-dashboard
Below are two dashboard developments that interact with the services implemented in OSCAR. A first dashboard has the function of interacting with all the services independently where you only have to enter the data to be processed and the OSCAR credentials. The second example presents a cascading development of two services (grayify and plants) that process images. In other words, the result of the grayify service (converts the image to grayscale), the plant detection algorithm is applied to it, which is implemented in the plants service. Here the user only introduces the image to be processed and the OSCAR credentials, resulting in what was stated above.
1.2. OSCAR services dashboard.
The developed interface is capable of invoking all the services that are in the OSCAR cluster without the need to modify the work flow. It should be noted that the flow was developed without using its own nodes or subflows (Figure 3), which shows that it is always necessary to use these elements since they can facilitate the work.
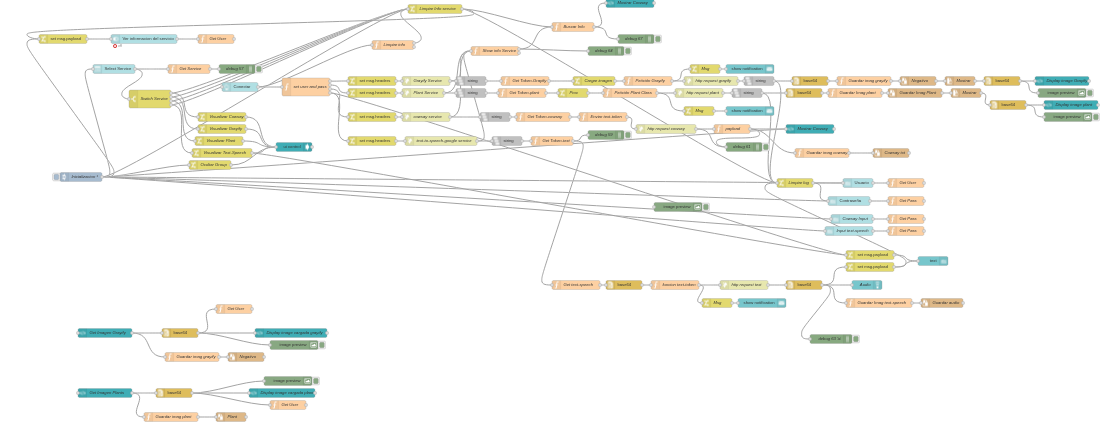
As it can be seen, it has a large number of nodes and connections, the .json file can be seen in the work attachments. Now once all the flows have been developed, the dashboard must be raised to be able to interact with the OSCAR services. For that, go to the upper right part (Figure 4).
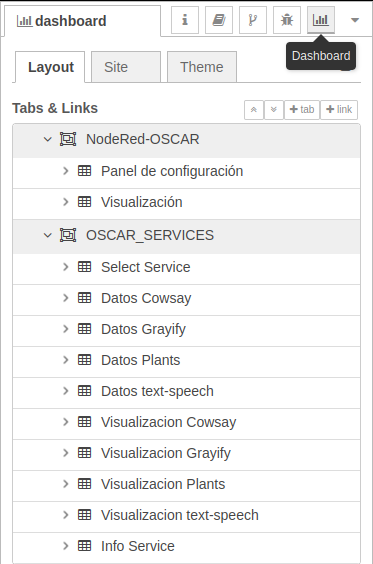
Once here, click on the icon that runs the dashboard and a new window is launched within the browser with the interface . Within this interface, the first thing to do is select the service that you want to invoke, as shown in figure 5.

In the first case, the Cowsay service is sectioned. Once selected, a series of components are displayed that must be filled out. These include the cluster username and password, as well as the text to be processed. Another element that could be useful can be selecting to see the information of the service, which will be displayed if the user wishes, as shown in figure 6.

After having all the data ready, the service is executed through the connect button and, depending on the service, the results of the service will be displayed in a more user-friendly way (Figure 7). If you want to run the service again with another word, you only need to modify the cowsay data field.

To execute another service, select it as shown in figure 8 and the work interface of said service will appear (Figure 9).


This grayify interface is the same as that of plants, so only one of the two is explained. Here, as before, the OSCAR cluster credentials will be entered. To load the image that you want to process, click on the Load Image button and the image will be searched.

Once you have the image (Figure 10) and the credentials, you can run the service as shown in Figure 11. If you want to run the service again with another image, just load another image and run the service again.

In the case of the text-to-speech-google service, it is very similar to that of Cowsay, except that here an audio would come out with the text that was sent (Figure 12).

These interfaces have the objective that the user does not have to change anything in the work flows and in turn reproduce in an easier way the work with the services that are implemented in the OSCAR cluster.
If you want to download the
.jsonfile of the workflow for all services for this example, you can get it from the oscar_nodered repository.
1.3 OSCAR Services Workflow Dashboard (Grayify-Plants).
In the following example we want to exemplify the workflow of invoking two OSCAR services consecutively (Figure 13). In other words, firstly, the grayify service is invoked and a grayscale image is obtained, and then this image is taken and the plants service is invoked to carry out the classification that this algorithm displays. For this, a flow is developed with its respective dashboard to be able to carry out said process.

The dashboard interface is very simple and it is only necessary to load the image for which you want to develop the process and enter the OSCAR cluster credentials as shown in figure 14.

From here, click on the connect button and the process will begin. Initially the first service will be displayed and then the second service will be executed. Visualizing the result of these processes in the interface developed as shown in figures 15 and 16.
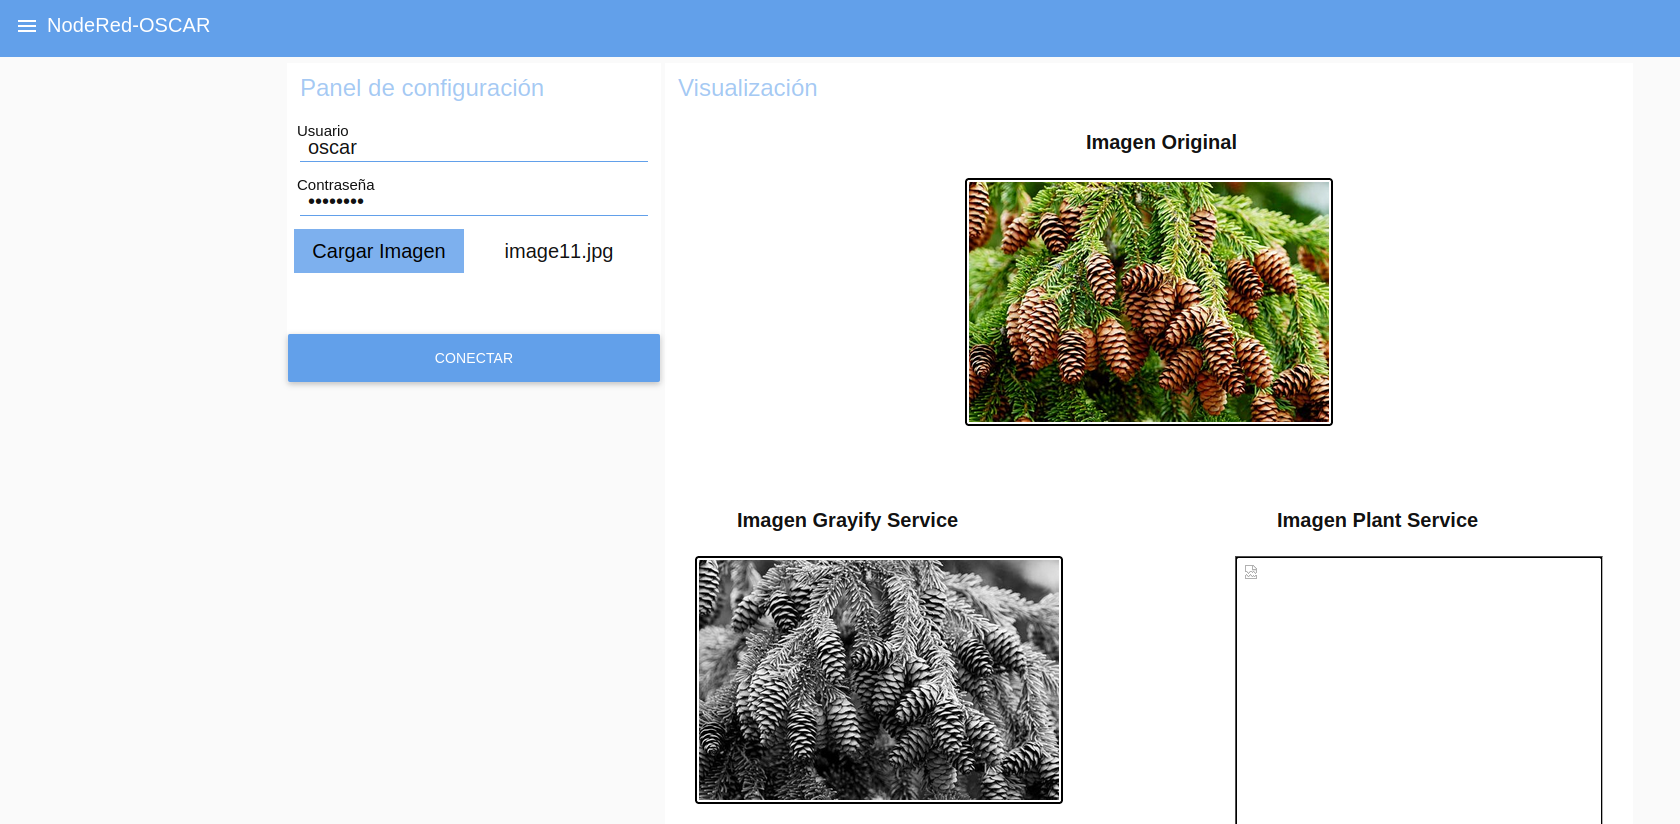
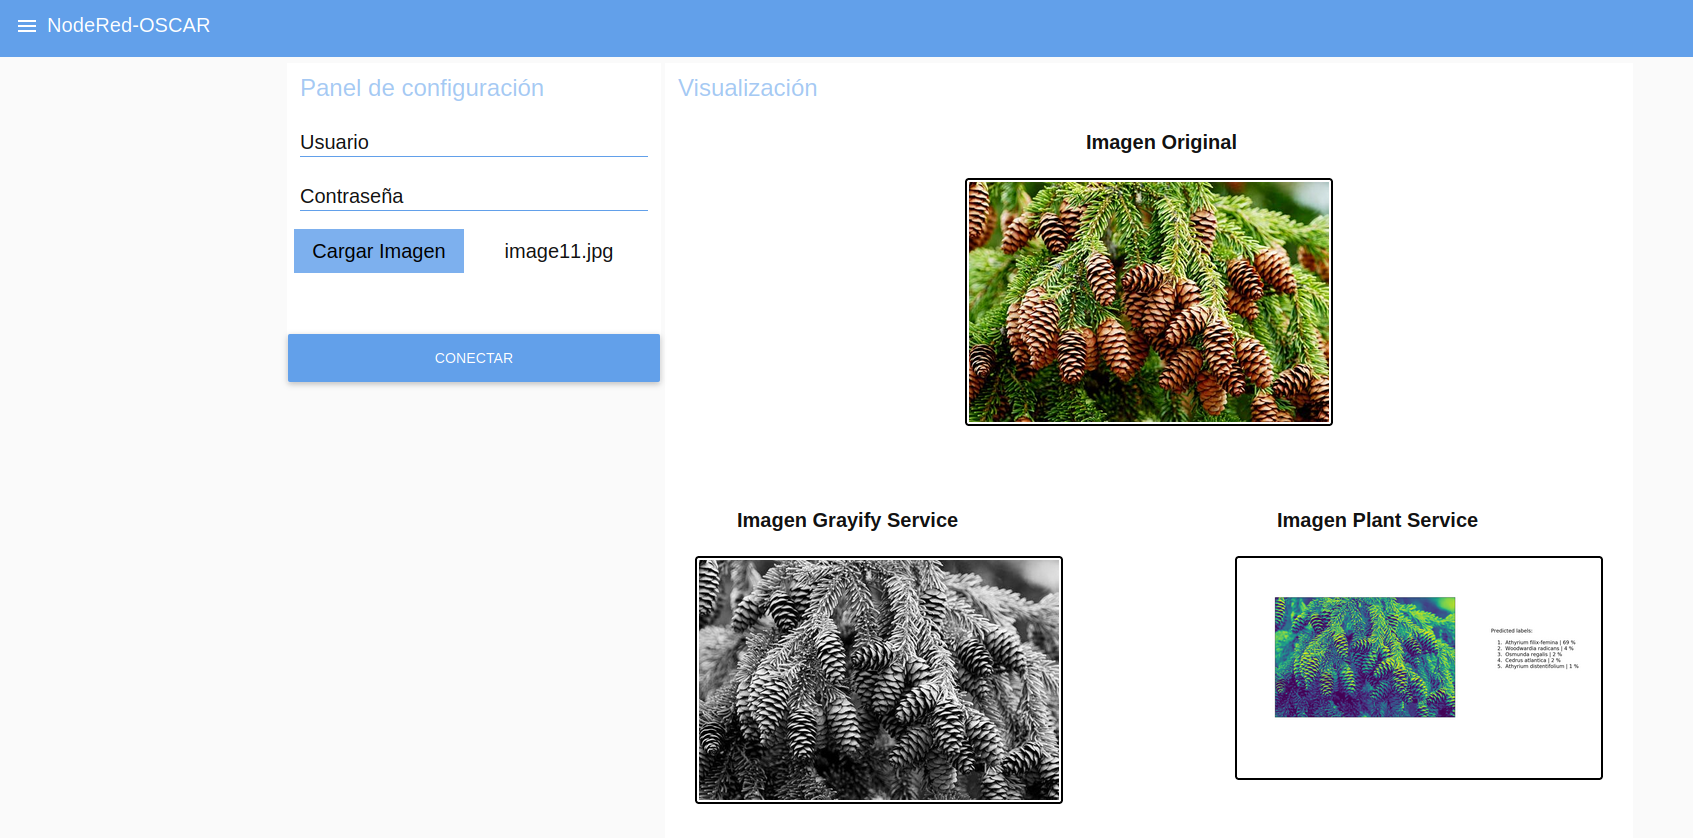
If you want to run the process again with another image, load it (Figure 17) and run the process (Figure 18). Clarify that when the process is executed for security reasons, the credentials that the user entered previously will be deleted, so it is necessary to re-enter them.
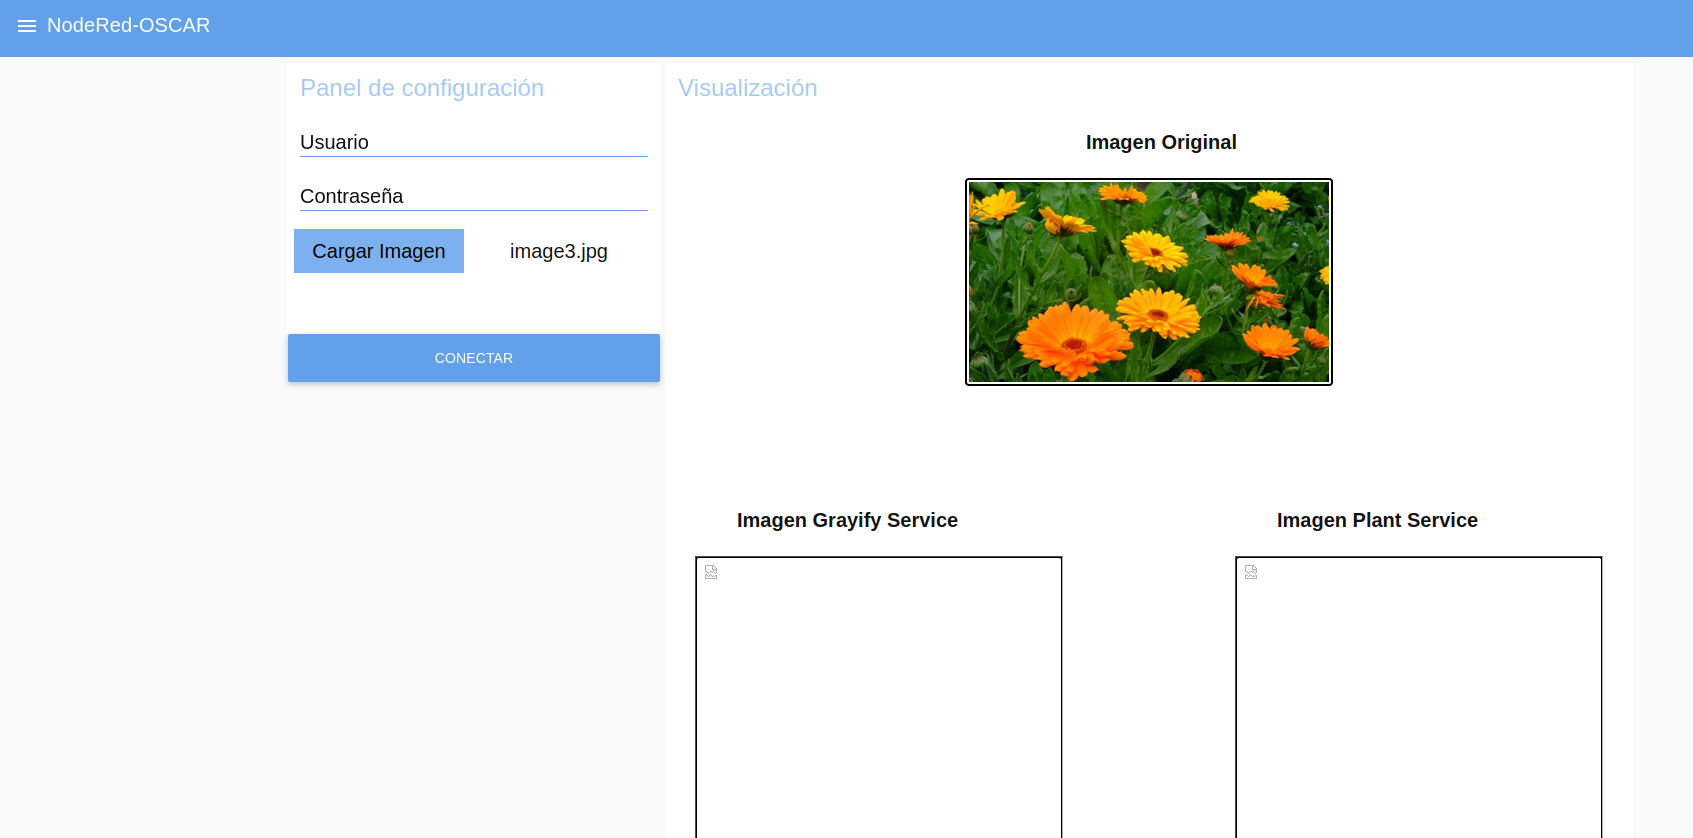
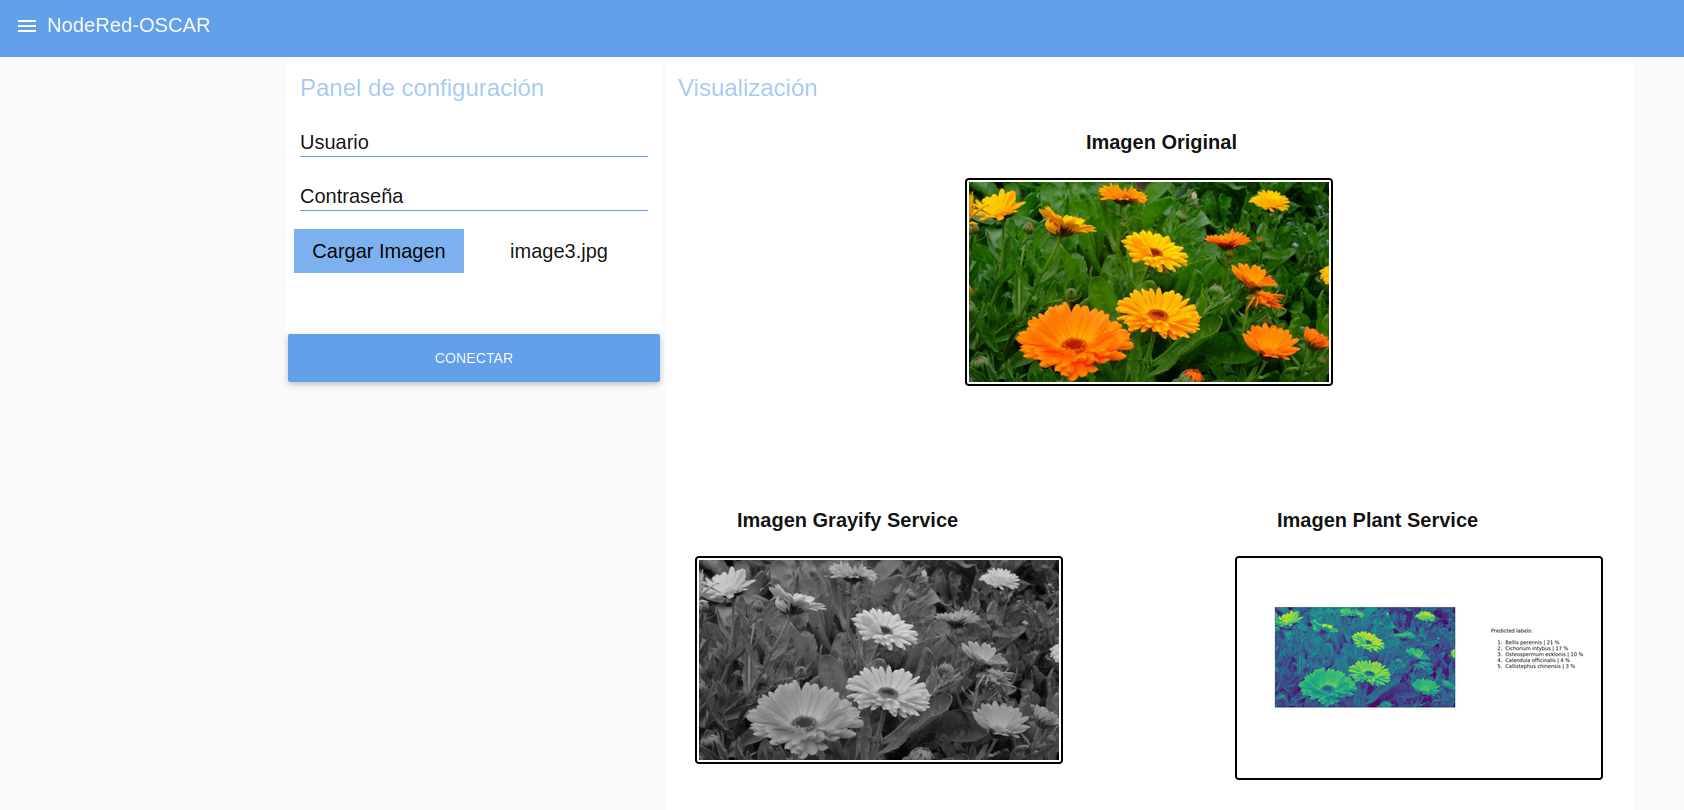
If you want to download the
.jsonfile of the workflow for two continuos services for this example, you can get it from the oscar_nodered repository.
This process demonstrates how easy it could be to invoke OSCAR services through Node-RED without having to execute command lines, just using the OSCAR API, which is abstracted away.
OSCAR-Node-RED is developed by the GRyCAP research group at the Universitat Politècnica de València.
